Visualise data from your device.
In this section, we will explain to you how to create widgets for data visualisation and set up your device's dashboard on Pybytes.
We assume that you already have your device connected to Pybytes. In case you haven't, check how to add your device here. After your done with that, you can proceed to the next example.
Step 1: Set up your application (main.py)
The first step is to have an application running on your device. The application in this example sends data from a vector every 10 seconds to Pybytes.
Open the
main.pyfile on Pymakr;Insert the following code on your
main.py;
# # Import what is necessary to create a thread
import _thread
from time import sleep

# # Increment index used to scan each point from vector sensors_data
def inc(index, vector):
    if index < len(vector)-1:
        return index+1
    else:
        return 0

# # Define your thread's behaviour, here it's a loop sending sensors data every 10 seconds
def send_env_data():
    idx = 0
    sensors_data = [0, -0.2, -0.5, -0.7, -0.8, -0.9, -0.9, -0.9, -0.8, -0.6, -0.4, -0.2, 0, 0.3, 0.5, 0.7, 0.8, 0.9, 0.9, 0.9, 0.8, 0.6, 0.4, 0.1]

    while (pybytes):
        pybytes.send_virtual_pin_value(False, 1, sensors_data[idx])
        idx = inc(idx, sensors_data)
        sleep(10)

# # Start your thread
_thread.start_new_thread(send_env_data, ())
- Upload the code into your device. Now your device is sending data to Pybytes.
In this code, we're calling the function
pybytes.send_virtual_pin_value(persistent, pin, value))to communicate with Pybytes. This function is part of the Pybytes library, and it has three arguments:persistent,pinandvalue.persistentdenotes information that is infrequently accessed and not likely to be modified;pinrepresents which virtual pin is receiving data;valueis the value being attributed to that particular pin.
Step 2: Add a signal from your device
Go to Pybytes.
On
Devicespage select a device;
On your device's page click on
Datatab.
Click on the
Define New Signalbutton.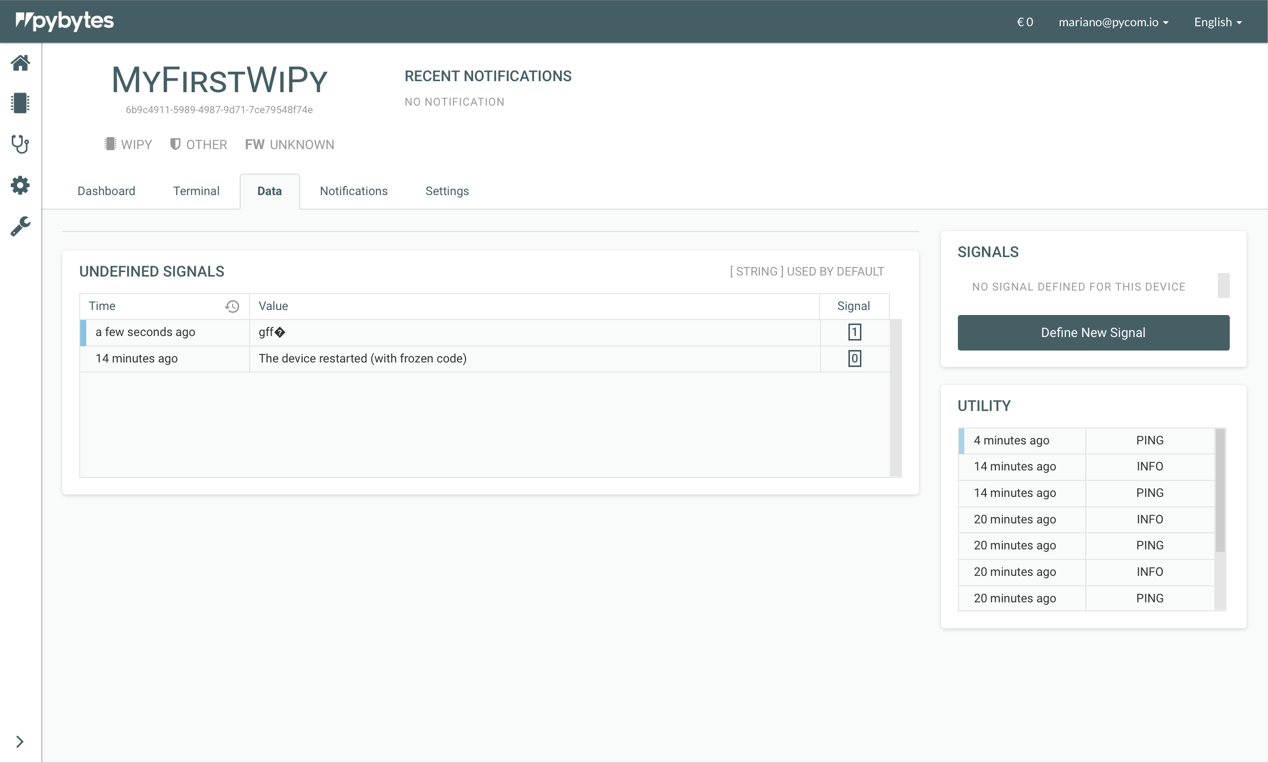
Define the new signal by entering a number, a name, a data type and a unit. Finally, click on the button
Define.
Your signal was added!
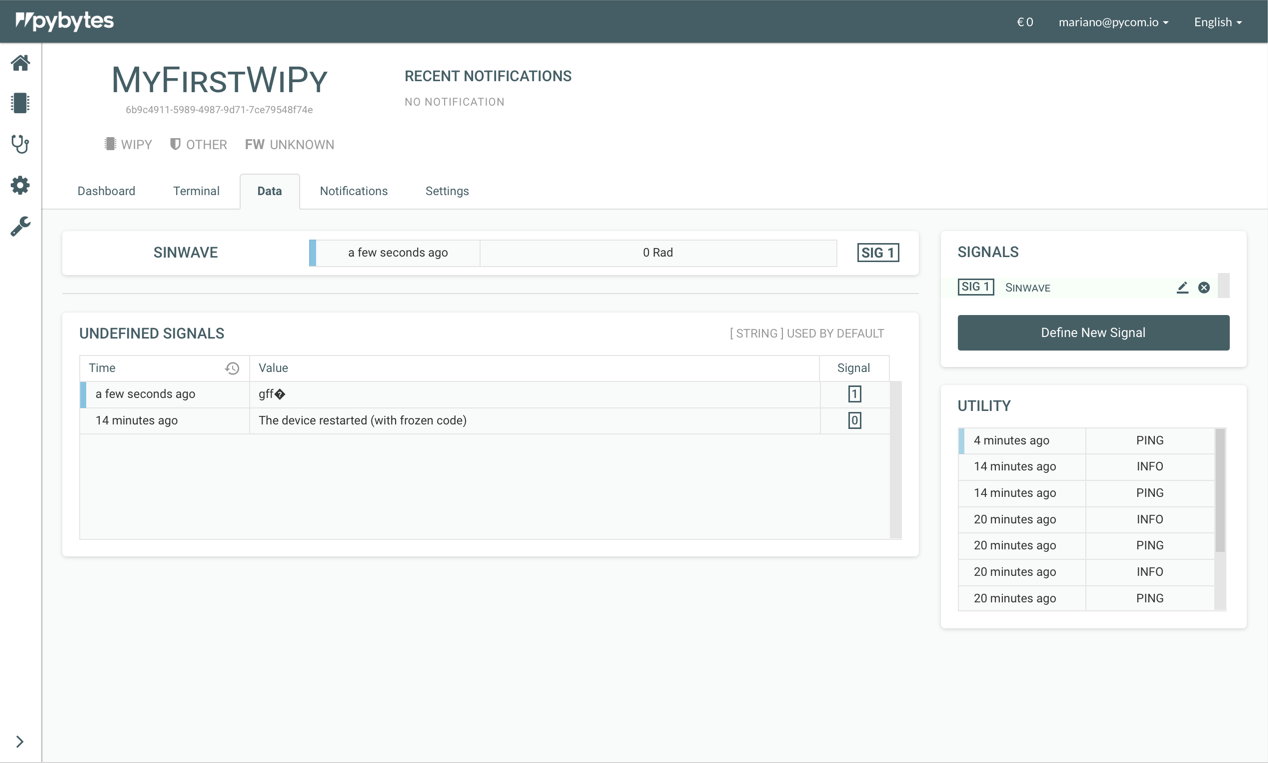
The name and unit are labels used to identify your signal inside Pybytes (In this example we defined Sinwave as the name of the signal and Rad as the unit).
The signal number has to match the pin number that you defined on pybytes.send_virtual_pin_value function call, inside your main.py code (In this example we defined pin = 1);
The datatype also has to match the variable used as argument on pybytes.send_virtual_pin_value function call, inside your main.py code (In this example our variable is a floating number; therefore we defined as a Float32).
Step 3: Add a widget for the signal
Click on the signal card.

Click on the button
Create a new display.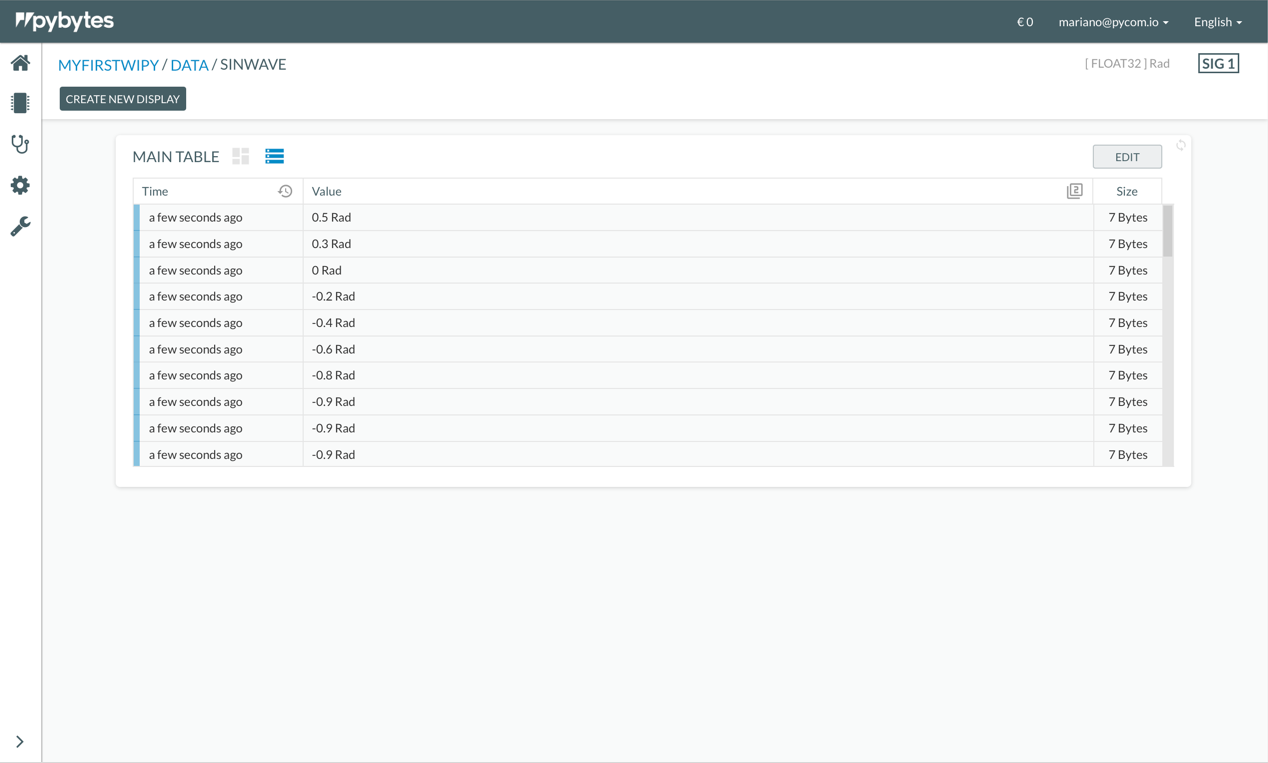
Select the type of visualisation (e.g. Bar chart or Line chart).
You can adjust the parameters of your widget at
Settings. After, click on the buttonCreate.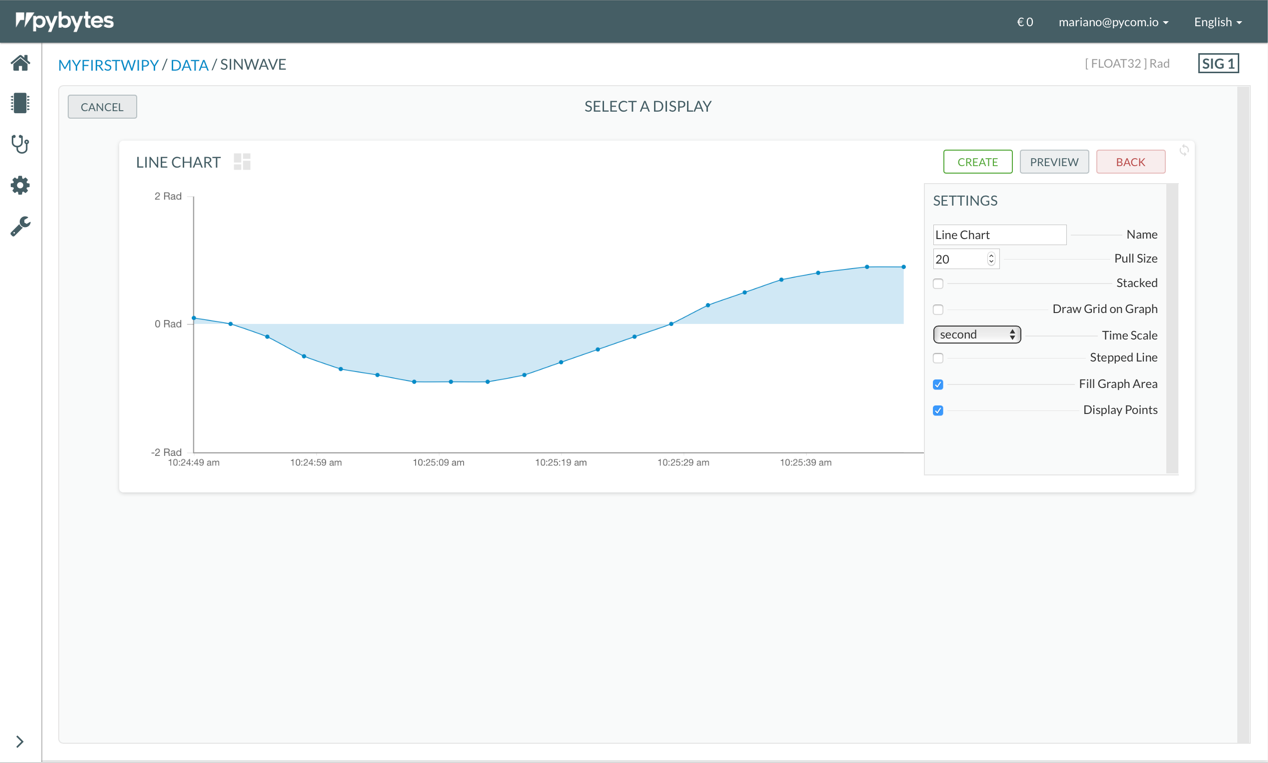
Your widget was created. Now, add your widget to your device's dashboard. Click on the button
Editon your widget.
Mark the checkbox
Display on DashboardatSettings. Finally, click on the buttonSave.
Click on the tab
Dashboard. Your widget was successfully added there!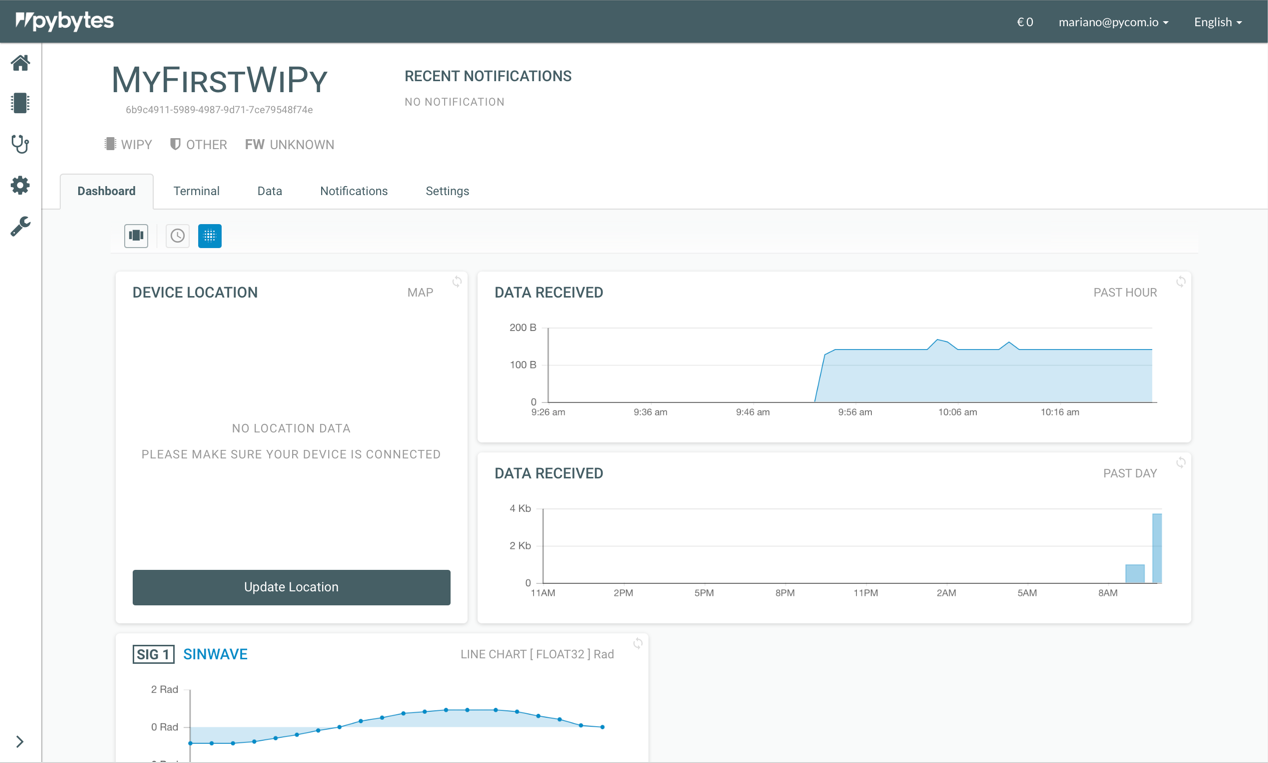
Step 4: Organise your dashboard
Click on the button
Organise. Now the dashboard's grid will enter the edit mode and allow you to resize and reposition its widgets.
Resize a widget by clicking on the triangle icon at the bottom right corner of the widget and drag the cursor over the grid. After, click on the button
Saveto save this action.
Change the widget's position by drag-and-dropping it over the grid. After, click on the button
Saveto save this action.
Done!
Now you've learned how to set up your device's dashboard to display data. Also, you can add more widgets to other pins of your device.